This week we will take a quick peek at the basic digital metrics that will help you run your business smarter. This assumes that you have set up Google Analytics for your website, and also linked your Google Ads and Google Analytics accounts.
The metrics you choose to follow and add to your dashboard will be a function of your business type and the specific outcomes that you are interested in. The most important thing to know before you look at the dashboard is that you will get the best insights by segmenting the data – by channel, by user type, by device, etc.
We will discuss what is available to you in Google Analytics. The Analytics dashboard will help answer the following questions:
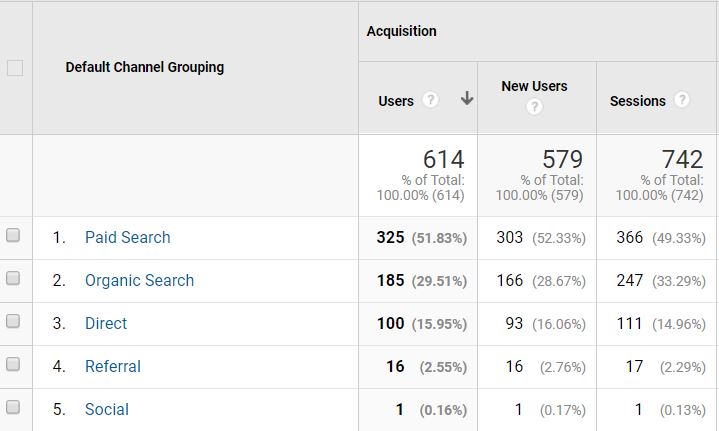
Acquisition – Where are your users coming from?
You want to quickly check which channels (Paid Search, Direct, Organic Search, Social, and Referral) your users are coming from. Look at the relative share of each channel and the trend over time. Here is sample data from a client. In this case, paid search accounts for the majority of users.
Behavior – What do they do on your website?
Check where your users are landing, and which pages they spend time on. It’s also helpful to look at the time spent and page depth by channel – which channel accounts for the stickiest traffic? Bounce rate should also be segmented by channel, and by user type (new vs. returning) to provide insights.
For a business that is investing in paid search, the goal is not simply to have a successful transaction, but also to convert visitors into repeat customers. To evaluate the success of your paid search strategy, look at the user retention metric (% returning users) over time for the paid search channel. The chart below shows new vs. returning users by channel for a specific time period.

Conversions – How many users took the desired action?
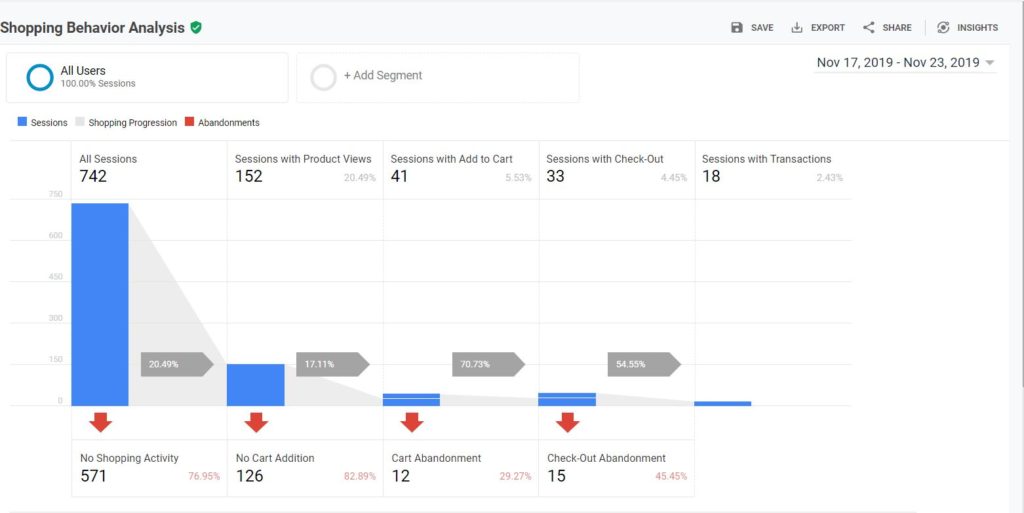
Conversions are the outcomes you are looking for – sales, newsletter sign-ups, emails, form submissions, etc. (I will cover the process of setting up conversions in my next post). Determine which outcomes are important for your business and set Google Analytics up to measure those outcomes. The chart below shows summary eCommerce data for a client.

The Conversions section in Google Analytics provides extremely useful data on the shopping funnel. Its called Shopping Behavior – see a sample below. This tells you exactly where you need to focus your attention. As with any other metric, you need to monitor this over time.
Next week we will look at setting up conversions and custom reports to simplify analysis.