Google Analytics has a dizzying array of metrics that it makes available to you, and its easy to get lost looking at “interesting” numbers that may not provide relevant insights.
First, Ask the Right Questions
Let me share a personal anecdote – as an enthusiastic summer intern in college, I was tasked with interviewing clients of a market research agency to find avenues for growth and improvement. I was very pleased with the list of 20+ questions that I presented to my mentor. I still remember the gentle chiding she delivered – “So which of these questions will get you the answers you are looking for, and which are simply interesting?” Chastened, I went back to my desk and whittled the questions down to the ones that would elicit answers the agency could take action on.
In your business context, reflect on what information will help you make decisions. Then translate that into the metrics that are available in Google Analytics.
Let’s say you are looking to assess the ROI of various marketing channels so that you can determine how to allocate your budget. Your question then is – what is the ROI of each marketing channel that I am using? To simplify further, we will focus only on the paid search channel for this discussion.
Next, Figure Out Which Metrics will Help Answer Your Question
To calculate paid search ROI, you need to know both spend and revenue for the channel. You want to ensure that the website has Google Analytics and Google Ads tagging enabled and that both accounts are linked.
Then, Set Up Analytics to Provide your Chosen Metrics
You can check Google Analytics for overall paid search spend for a given time period. You can also see conversion data by campaign in Google Analytics – you are interested in total conversion value for the given time period. Now simply use the ROI formula to calculate paid search ROI.
See below for a screenshot of where you can find this data in Google Analytics.
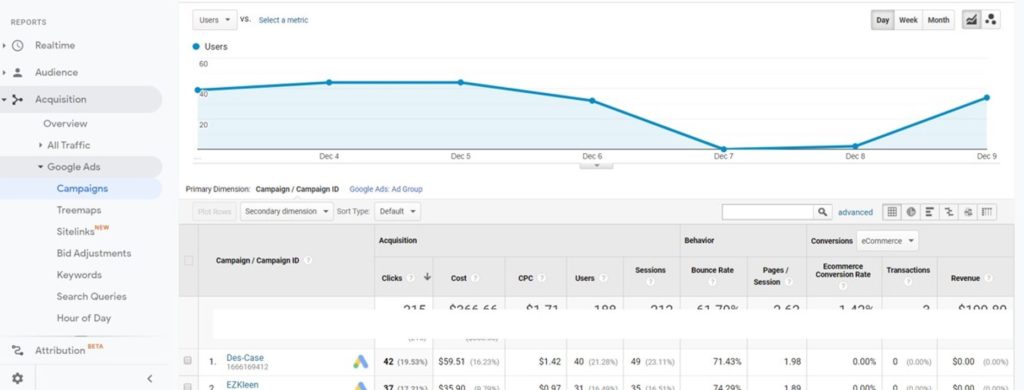
To view conversion data by campaign in Google Analytics, you will need to enable e-commerce tagging.
Note: If you want to look at non-e-commerce conversions, such as leads, then you will want to make sure that you set these up as goals – typically you will use destination goals or event goals. You can look at these links to get started.
About Goals – https://support.google.com/analytics/answer/1012040#goal_types
Create, Edit & Share Goals – https://support.google.com/analytics/answer/1032415?hl=en
Finally, Create Custom Reports
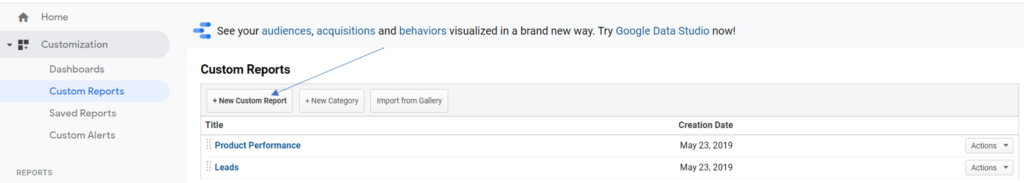
Though you can look at the outcomes you care about in the Conversions section under Goals or E-commerce, you will save time by defining Custom Reports with the relevant dimensions and metrics. Once you save these, you can always find them in the Customization section just below the Home button on the left navigation menu.
To create a custom report, simply click on the button to add a New Custom Report.
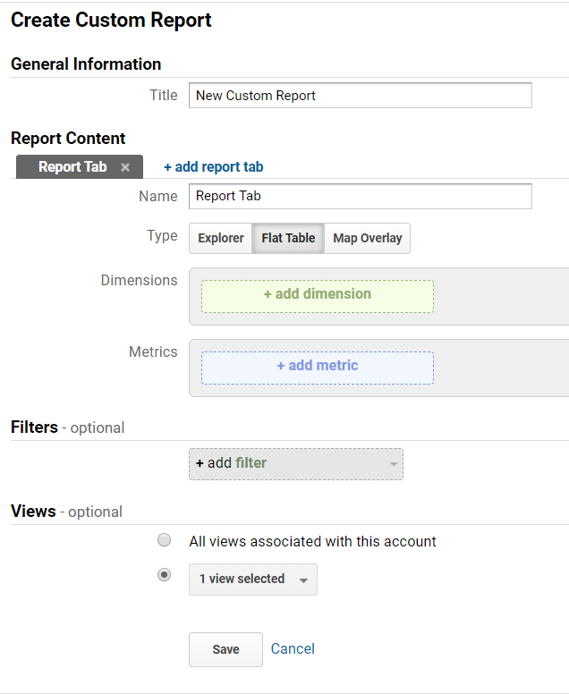
Next, pick the report type that works best for you – Flat Table, Explorer or Map Overlay.; Flat Table works well for most common needs. Then, pick the dimensions you want to review and finally, select the metrics.
See a sample report below. I use this to see revenue by product, channel, campaign and time of day. I have also added Keyword as a dimension, which is really helpful in determining keyword strategy.
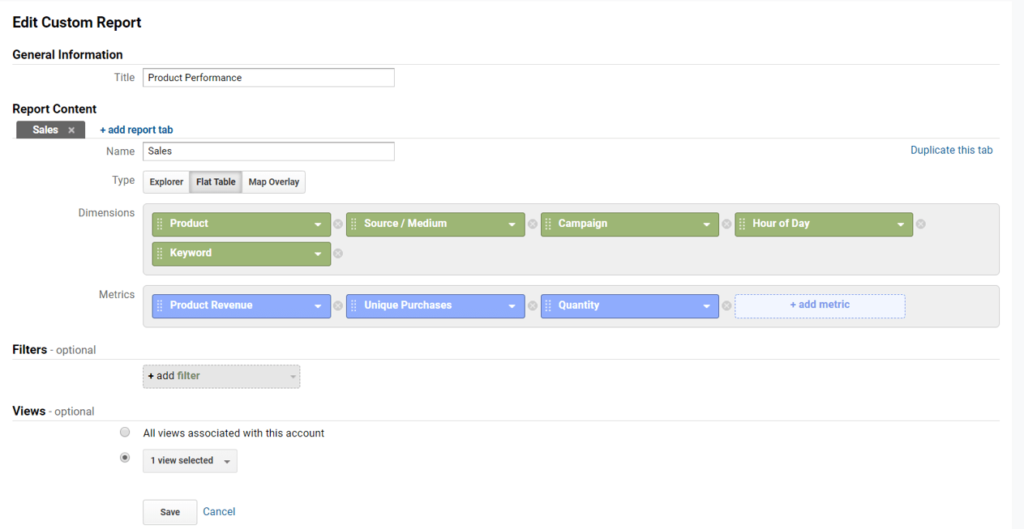
That’s it, you are now all set to measure what matters!